30 days of real ecommerce chatbot traffic: what the numbers tell us
An anonymous 30-day snapshot from a live online store: 31 conversations, 83 visitor messages and a 2.5-second median to the first saved text reply. What these figures show, and how to use them in your own monthly review.
After a month of running an ecommerce chatbot, count the conversations, check response timing and review whether the answers helped.
We examined retained production records from one real online store using Breezaro. This anonymous snapshot measures activity and response timing at an existing installation; it is not a before-and-after experiment.
The 30-day snapshot
The period runs from 9 August 2026 at 00:00 UTC up to, but not including, 8 September 2026 at 00:00 UTC.
| Measure | Observed result |
|---|---|
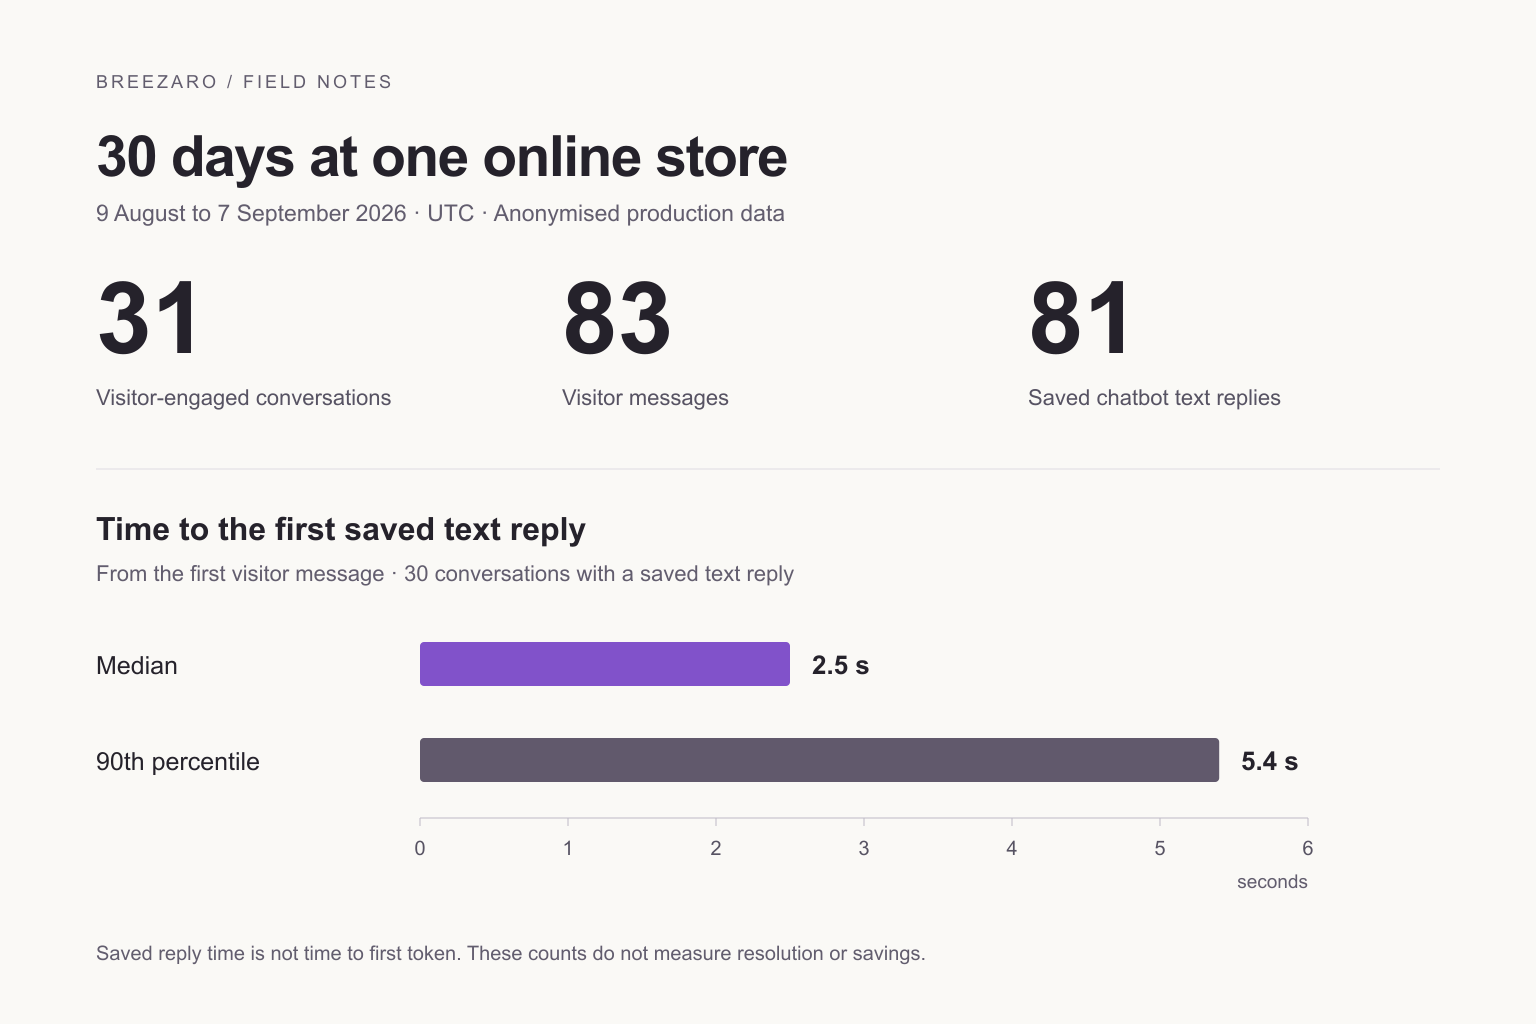
| New conversations with at least one visitor message | 31 |
| Visitor messages in those conversations | 83 |
| Saved chatbot text replies | 81 |
| Channel represented in the selected conversations | Website widget |
| Median time to the first saved text reply | 2.5 seconds |
| 90th percentile of that time | 5.4 seconds |
What exactly did we count?
A conversation qualifies when its record was created during the period and it contains at least one visitor message before the cutoff. Opening a widget without sending anything does not qualify. Neither does a proactive greeting on its own.
The selected installation was a real, non-demo shop. Comparison-tool conversations were excluded. All qualifying conversations used the website widget; these numbers therefore do not describe WhatsApp, Messenger or Instagram support. Tests typed into the live widget cannot be independently separated from customer traffic using these aggregates.
Within each qualifying conversation, we counted visitor messages and saved chatbot replies with non-empty text, from the first visitor message to the period cutoff. Greetings before that first message, proactive messages, system events, failed reply records and outputs without text were excluded from the reply count.
The unit is a conversation, not a unique person or an order. Several conversations can belong to the same visitor. Existing conversations that continued from before 9 August are outside this sample, as are replies recorded after the cutoff. Records already permanently removed cannot be recovered in this snapshot.
How to read the response time
For each conversation with a saved text reply, we measured the interval between the first visitor message being recorded and the first chatbot text reply being recorded. That timing sample contains 30 conversations.
Its median was 2.5 seconds. The middle of the observed distribution was therefore around two and a half seconds. The 90th percentile was 5.4 seconds, which helps describe the slower end without relying only on an average.
This is a server-side persistence interval. It does not measure when the first streamed word appeared, when the browser displayed the complete response, or how quickly a person read it. Those questions require different measurements. It is also the first reply in each conversation, not the speed of every subsequent answer.
What these figures leave open
The store recorded more visitor messages than conversations, so the sample includes exchanges beyond an opening question. The totals do not establish whether those follow-up messages were useful clarification or a customer repeating an unanswered question.
Human handover and resolution are not evaluated in this report. We did not assess message contents, connect chats to purchases or compare operator workload before and after installation. There is consequently no measured sales uplift or time saving to report. This is one small store-level sample, not a benchmark or a performance guarantee.
Turn your own first month into a useful review
The following steps are recommendations for your shop, not changes carried out as part of this observation.
1. Keep the sample consistent. Pick a fixed period and write down whether you count newly created conversations or every conversation active in that period. Keep widget traffic separate from messaging channels. Use the same definition next month.
2. Review the answers against your actual information. For a sample this size, checking every conversation may be practical. Mark whether the reply matches your shipping policy, product page or other approved source. Keep an “unclear” outcome when the record does not establish what happened. The chatbot testing checklist gives you concrete cases to retest.
3. Separate missing content from missing access. An unclear delivery explanation may need a better FAQ. A request for a particular order needs an appropriate verified connection to the order system. Adding more generic text will not supply live order data. Use the ecommerce FAQ template for the first category.
4. Check the slow cases individually. Compare them with ordinary replies and note what the bot was doing. Set your own acceptable response target, then track whether changes improve that measure without reducing answer quality.
5. Change one thing you can verify. Correct an ambiguous source, retest the relevant questions and record the date. At the next review, compare the same measures and explain any seasonal or traffic changes. Our guide to chatbot measurement introduces the wider dashboard context.
A defined sample, an answer review and one checked improvement give your next month a clear purpose.