How to measure chatbot success, and which numbers mislead you
A conversation count on its own tells you nothing. Here are the metrics that actually say something about a chatbot, containment, handover, fallbacks and first response time, and where to find them in Breezaro.
The chatbot has been running for a month. Is it working? Most people look at the conversation count, see a number going up, and feel good about it. But a rising conversation count can mean success just as easily as it can mean your website says something so unclear that people have to ask. Here are the numbers that tell the two apart, and a warning about the ones that mislead.
Visits to chats
The first useful number is not the conversation count, it is its ratio to page views. Ten chats per hundred page views is a completely different thing from ten chats per ten thousand.
Two caveats come with it, because without them it reads wrong:
- It counts the website widget only. Conversations from WhatsApp, Messenger and Instagram do not enter this ratio; you will find those in the per-channel breakdown.
- The denominator is views, not people. One visitor browsing five pages sits in it five times. So it is not the share of visitors who started writing, however much it reads like one.
- It can come out above one hundred percent. That is not a bug. One visitor can start several conversations on a single page view, and conversations older than your traffic measurement count too. Clamping it to a hundred would look more credible and would be a lie.
The funnel that shows where people drop
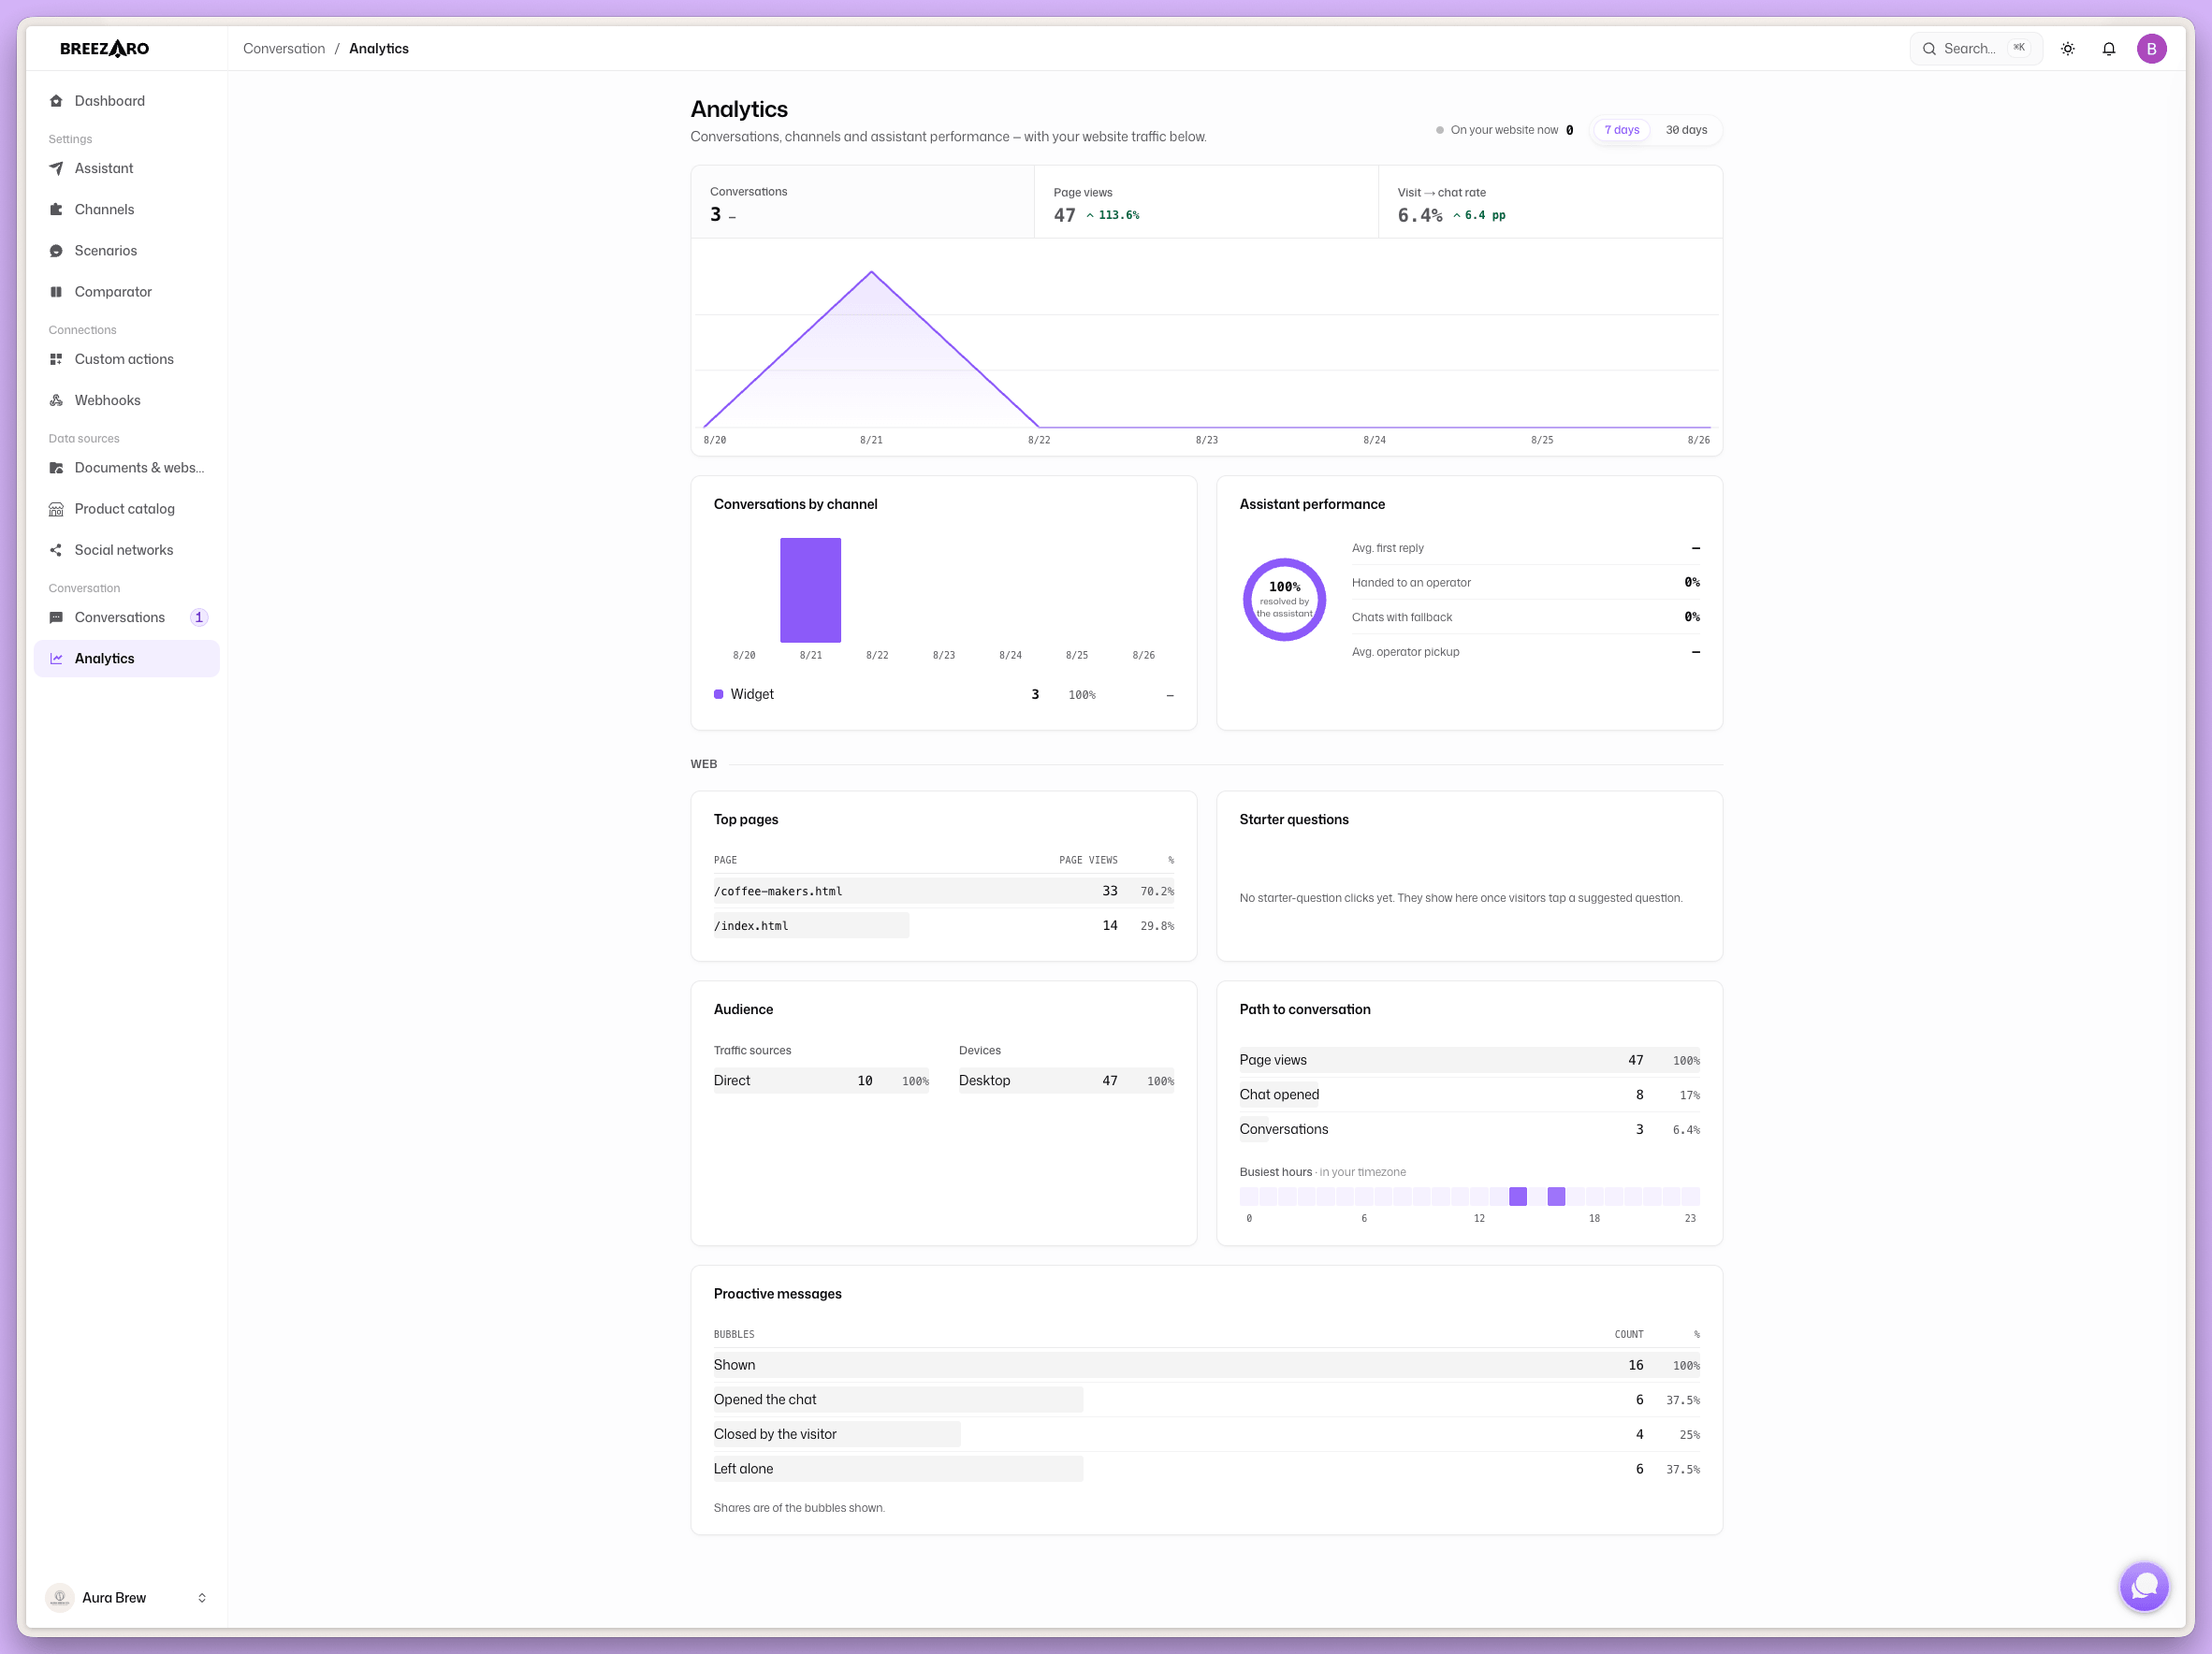
The ratio gives you the outcome, the funnel gives you the reason. It has three floors: page views, chat opens and conversations.
Between the first and the second you learn whether the widget is visible and inviting. If almost everything falls through here, work on placement, colour and the greeting. Between the second and the third you learn something else: people opened the chat and wrote nothing. That usually means the opening message never says what the bot helps with, so the visitor does not know what to ask.
The two metrics that actually matter
This is where a chatbot that saves work separates from one that creates it.
- Containment rate is the share of conversations that finished without a human. This is the number that turns into savings. The higher it is, the less lands on you.
- Handover rate is its other side, how often an operator took a conversation over. A low one is not a win by itself. When it sits near the floor and customers still complain, the bot is not handing over when it should.
A healthy state is not one hundred percent containment. It is the bot handling the routine and reliably passing on what it should not touch.
Fallbacks, the places the bot does not know
The fallback rate shows conversations where the bot found no answer. It is the most direct to-do list a chatbot will ever hand you: every fallback is a question you have no content for.
Do not read it as a grade. Read it as a brief for filling the knowledge base, the method is in how to train your chatbot. Watch one confusion though: a fallback means the bot admitted it did not know. That is correct behaviour. The worse case is a bot inventing an answer, which never shows up in this metric and is covered in why an AI chatbot makes things up.
Speed, in two separate numbers
Two durations get tracked and they are often confused. Average first bot response is about technology and usually lands in seconds. Average time until an operator replies is about you. It runs from the visitor's last message to the first human reply, so it holds more than your own delay: the stretch where the bot was still trying is inside it too. The customer waited exactly that long, which is what makes it an honest number.
When it is high, a better prompt will not help. Phone notifications will.
Where they browse and what they ask
The rest of the dashboard is guidance rather than judgement, but two views are worth reading regularly.
Top pages show your most-viewed pages, ranked by page views. Mind the usual confusion: these are not the pages people write from, that link is not calculated here. The top row can easily be a page nobody has ever started a chat on. Read them as context for where your visitors spend their time.
Starter question clicks tell you whether you guessed right. A question nobody clicks is just taking up space. Swap it for one you keep seeing in the fallbacks.
Alongside those come traffic sources, devices and busiest hours. The last one is for operational decisions, namely when it is worth having an operator around.
Proactive bubbles have their own funnel
If you use proactive scenarios, they are measured separately in three steps: how often the bubble was shown, how often the visitor dismissed it, and how often they opened the chat. The ratio between shown and opened is the only honest measure of whether reaching out helps or merely annoys.
Reading them together
Once a month, take four numbers and compare them against the previous period shown beside them: visits to chats, containment rate, fallback rate and operator first reaction. The first two say whether the chatbot is helping. The third says what to add. The fourth says whether the human half is working.
Everything else is context. And if you want to turn those numbers into money saved, the calculator is in how much an AI chatbot can save you.
FAQ
What is a good containment rate? It depends on what people ask you. Instead of somebody else's number, watch your own trend, and whether complaints rise as containment rises.
Why is my visits-to-chats ratio above one hundred percent? Because it is not clamped. One visitor can start several conversations on a single page view, and conversations older than your traffic measurement are counted too.
Do WhatsApp conversations count in that ratio? No. The ratio covers the website widget only. Conversations by channel sit in their own breakdown.
What do I do about a high fallback rate? Treat it as a list of missing content. Go through the conversations where the bot did not know and fill the knowledge base.
You will not judge a chatbot on one number. But four are enough, and all of them sit in the Analytics view, over the last seven or thirty days, always against the previous period.
Related: How much an AI chatbot can save you · How to train your chatbot.